 |
Issue #4 - published by the IMPReSS project - March, 2016 |
 |
 |
 |
 |
 |
The IMPReSS Project Comes to an End |
 |
 |
After two and half years, the IMPReSS project has now officially ended. And the project consortium is now preparing for the final review which will be held in April in Recife, Brazil
The project has been very productive, not only in terms of all the research and development work involved in developing the IMPReSS Systems Development Platform but also in terms of presenting the IMPReSS project in national and international high profile conferences, exhibitions and workshops. The project consortium has also been particularly productive with respect to writing scientific papers related to IMPReSS; 13 papers have been accepted for publication including 5 dissertations. A video showcasing the Teatro Amazonas pilot has also been produced (shortly available via the project website) and students at UFPE have been involved in a usability evaluation of key IMPReSS components. All in all, these past two and half years have been a rewarding experience for all project partners and for the many students on both sides of the Atlantic who came into touch with the project, and the business models developed in the project show that there is substantial potential for the future exploitation of the IMPReSS SDP and IMPReSS enabled applications for a smarter society.
to
the top  |  |
 |
 |
 |
| | Usability Evaluation of IMPReSS |
|
 |
The IMPReSS project has developed a Systems Development Platform (SDP) that enables developers to develop smart society systems and applications in a cost-effective and efficient manner. An integral part of any research and development work is of course evaluation of the results. One of the evaluation activities done in the project was a usability evaluation of five central IMPReSS components.
The usability evaluation of IMPReSS was of course done by the main end-user, namely IoT application developers. In our specific context, 10 students from UFPE who represent future application developers participated in the evaluation. As students they also represented less experienced developers which was an added bonus as one of the aims of IMPReSS is to solve the complexity of system development by providing a holistic approach.
The five tools that were tested and evaluated were: the Application Description Generator, the Resource Adaptation Interface (RAI), the IoT Resource Catalogue, Context Manager, and the Mixed Criticality Resource Management Tool.
The Usability Workshop
Participants were asked to conduct different programming tasks with each of the tools. This way, participants could get a feeling of how IMPReSS supports application development in practice. Immediately after having completed a task, participants evaluated the tool by filling out the well-known User Experience Questionnaire (UEQ) http://www.ueq-online.org/
developed by Laugwitz, T. Held, and M. Schrepp (2008).
The UEQ captures the usability and user experience perception of a product. The items have the form of a semantic differential, i.e. each item is represented by two terms with opposite meanings. A seven-stage scale is used to reduce the well-known central tendency bias for such types of items. The items are categorised into six dimensions each of which consists of 4-6 items on the UEQ which thus describes a distinct quality aspect of an interactive product, namely Attractiveness, Efficiency, Perspicuity, Dependability, Stimulation and Novelty. The UEQ comes with a complete data analysis tool in Excel including a benchmark data set.
The five individual IMPReSS components were all evaluated and in addition participants were asked to give an overall evaluation of all the tools, thus representing an overall evaluation of the IMPReSS System Development Platform (SDP).
Results
The results represent the average result for each of the six dimensions. In addition, the benchmark results are also presented, i.e. each tool has been compared against the benchmark data offered by the UEQ data analysis tool. The results have been interpreted using the tools provided by the UEQ and analysed in context, i.e. by taking the complexity of the task and the component into account. The response rate has also been considered in the analysis.
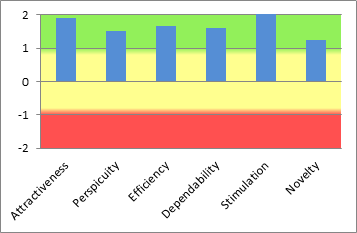
The average result for the IMPReSS SDP usability evaluation is illustrated in the graph below. Overall, the result is very satisfactory as all of the six dimensions received the score “Good” or “Excellent”.

The result for the IMPReSS SDP corresponds well with the individual results for the five evaluated tools. All five tools received positive scores for all of the six dimensions. Like the IMPReSS SDP, the top three dimensions for the individual tools were also Attractiveness, Efficiency and Stimulation. However, there is a stark difference within this top three, namely that while the IMPReSS SDP got the highest score for Stimulation, the average score for Efficiency was the highest for the five components. The Efficiency score was the highest for the Mixed Criticality Resource Management tool, the Application Description Generator tool and the Context Manager tool; all in the range of “Good” and “Excellent”.
On average, the Novelty dimension got the lowest score of the six dimensions for both the IMPReSS SDP and the individual tools. The IoT Resource Catalogue, the Application Description Generator, and the Context Manager got the lowest score for Novelty; however, the scores were still in the positive range.
Two tools, the RAI and the Mixed Criticality Resource Management tool, scored “Good” and “Excellent” for all six dimensions; the Mixed Criticality Resource Management tool received the overall best score of the five evaluated tools. The Application Description Generator tool got “Good” and “Excellent” scores for five dimensions but got the lowest score for Novelty dimension out of all of the five tools.
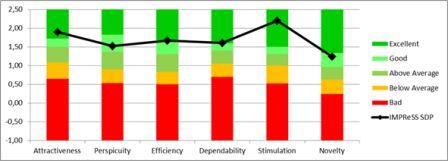
The benchmark results are very good for the IMPReSS SDP and it is indeed positive to see that Novelty, which was the dimension which received the lowest score for some of the individual tools, lies within the “Good” range. It is also quite exciting to note that four out of six dimensions were evaluated as “Excellent” (Attractiveness, Efficiency, Dependability, and Stimulation). The SDP benchmark results are illustrated in the graph below:

The benchmark results for each of the IMPReSS tools are consistent with the benchmark results for the SDP. As for the SDP, the dimensions that scored the highest in relation to the benchmark were Attractiveness, Efficiency, Dependability, and Stimulation. More specifically, three tools scores “Excellent” for Attractiveness and Efficiency in comparison with the benchmark. Four tools scored “Good” for Dependability and in relation to “Stimulation” one tool scored “Excellent” and two tools scored “Good”.
In conclusion, IMPReSS received a very positive usability evaluation which confirms that the IMPReSS SDP offers application developers easy-to-use tools for developing smart city applications.
to
the top  |
 |
 |
 |
 |
| |
IMPReSS Business Models |
|
 |
Two distinct business models have been developed in the project; one of each of the pilot sites. The aim of the IMPReSS business models is to make an early assessment of the business impact to can be expected from the IMPReSS platform in the area of energy management and conservation.
The notion of ‘business models’ is used to describe the complex environment in which companies and organisations are operating; having to deal with new disruptive technologies, rapidly changing demand patterns, decreasing customer loyalty and constantly facing new entrants onto the market.
The business models in IMPReSS are an abstract (or exemplary) description of a company’s entrepreneurial activity related not only to the development of a new energy management platform, but very much to the actual deployment and operation of it.
Newer definitions also focus on how a company or an organisation creates and delivers value to their customers, together with other actors and partners in a coherent system so that is captures value that the customers are willing to pay for (Osterwalder & Pigneur 2010):
“A business model describes the rationale of how an organisation creates, delivers and captures value”
The IMPReSS business model has focused on defining value creation and identifying new business opportunities. The modelling of value is centred on the concepts of value proposition (what for whom and how), value constellations (value network of actors) and value configuration (how do we operate and deliver) – and not on processes. We have used the e3value method which is based on the analysis of economic value creation done by Jaap Gordijn (Gordijn 2002).
The e3 value tool allows us to do complete calculations on the cash flow for each of the actors in the model. It is important to note that the e3 value model focusing on identifying the value objects that are being exchanged between the actors and that value objects do not need to be a monetary value. This means that money will not need to be exchanged between all the actors in the model. Based on actual energy prices and energy consumption figures, we have been able to do complete calculations that show that the business models are economically sustainable.
UFPE Business Model
The business model has been developed on the basis of the following scenario:
The UFPE campus is a large consumer of energy and can be compared to a small town; using electrical energy for public lightning, water treatment and pumping, traffic control, etc. UFPE has requested that their energy system is updated including installing smart meters and an automatic criticality system. The lack of clarity of where, to what and how much energy is consumed on campus represents a real problem because it makes it virtually impossible to implement efficient energy saving and energy cost reduction savings. The university campus wishes to be on the forefront with respect to being sustainable and energy efficient. Also, as one of the top ranking universities in Brazil, there is a need for more power stability achieved through an automated criticality system. With the implementation of the IMPReSS enabled Smart Energy Management system, the university expects to reduce their energy consumption by 10%.
Teatro Amazonas Business Model
This business model takes as its starting point the perspective of the City of Manaus. The City of Manaus has a strategic goal improve citizens’ lives and to attract new residents by promoting itself as a smart city. One of the main smart city target areas is smart environment focusing specifically on how smart energy management can reduce energy consumption and the CO2 emissions; the geographical local of Manaus in the Amazon Rainforest makes environmental sustainability an obvious choice of focus. The IMPReSS enabled Smart Energy Management System and Application has been installed in a number of public buildings in the city with the purpose to better manage and monitor energy consumption and thereby reduce it up to 10%. %.
to
the top  |
 |
 |
 |
 |
| |
Crossing Over the Atlantic: Tales from a Fraunhofer FIT Research Associate’s Experiences at the Federal University of Pernambuco in Brazil |
|
 |
The collaboration between Brazilian and European partners in the IMPReSS project took a unique turn as Ángel Carvajal Soto, a Research Associate at FIT in Germany, travelled across the Atlantic to Recife in Brazil to work on IMPReSS alongside Lucas Gomes, a Research Fellow at UFPE. In this article, Ángel shares some of his Brazilian impressions, and it is clear that both professionally and personally the experience has been invaluable.
I have to confess, before I took part of this project and trip, I didn’t know much about Recife. So, I will start with a bit of information about Recife. The city of Recife is the fifth largest city in Brazil and capital of the Pernambuco State. The city is located in at the eastern part of the North-East Brazilian region. It comes with tropical warm weather; the locals describe the seasons as “the hot season” and “the damn hot season”. In my time there the weather was moving to the “damn hot season”, nevertheless as a coastal city, Recife has a nice marine breeze.
Most of my time was spent in the Networking and Telecommunications Research Group (GPRT) Lab facilities at the Universidade Federal de Pernambuco (UFPE). It took a bit of time before I found my way to the GPRT comfortably but thanks to Prof. Kelner, I became independent by bus in the high complex streets of Recife in the end. At GPRT I learnt that the locals love to turn the AC up, way up, to reach a really low temperature in the room; the IMPReSS focus on energy efficiency systems is certainly relevant here.
At the beginning my main concern was security. Recife is ranked high as unsecure city. Additionally, I was intimidated by the security peripheral walls with vigilance towers in all buildings. But with time I got to know the city, and what to do and what not to. After two weeks, I was feeling like a local. Well, being Mexican helped me a lot, with the appearance and language. In Recife, as in most parts of Brazil, not that many people can speak English but you can get by if you are a native Spanish speaker. The fact that the locals don’t speak your language, don’t stop them from having, or trying to have, a conversation with you.
Starting up my work was not easy. I felt at the beginning a bit lost. Without my own computer, and some technical problems, everything was a bit different. Thanks to Lucas Lira Gomes, a Research Fellow at GPRT also involved in IMPReSS, the work could start, and it was an intensive month. Nonetheless, the hard work was accompanied by nice weekends in paradisiacal virgin beaches, which I will not forget.
Lucas and I decided to put our skills together. He provided his experience in Machine Learning, and I brought my knowledge in Complex-Event Processing (CEP). Machine Learning (ML), is a series of advanced algorithms for pattern discovery by empiric input. Complex-Event Processing, also known as stream processing, is a technique developed to process the data as it comes, allowing to process non persistent data. Combing this techniques with other IoT communications protocols, i.e. MQTT, allowed us to perform automatic learning in the cloud as well as at the edge of the network (e.g. at gateway level). This technique exploits the computational power spread in the network. Additionally, we designed an experiment to prove the feasibility of running such a system at the gateway level.
Using the IMPReSS SDP, an array of sensors was deployed in the lab such as consumption sensors and motion sensors. To process this Data in real-time, the IoT Service agent was put in place. The service, named IoT Learning Agent, uses CEP queries to pre-process data in real-time in order to be later on fed-in into the increasing learning. The CEP engine provides the tools needed for pre-processing the data efficiently and tools for real-time data management to deploy rules after the learning phase. ML provides the pattern recognition that allows you deploy more complex rules otherwise not possible. For our experiment, we selected the learning algorithm Stochastic Gradient Decent implemented in Weka. The work proved to be harder than expected; hardware constrains, poor quality data, and loss of some of the sensor datasets were some of the problems encountered. An article describing the early results is currently in preparation.
I have to admit that it was not easy to be a stranger in Recife in the beginning. But at the end, I didn’t want to leave Recife.
José Ángel Carvajal Soto has been a Research Associate at Fraunhofer FIT since November 2013. In addition to his involvement in the IMPReSS project and other EU research and development projects, Ángel is also carrying out research on Complex-Event Machine Learning.
to
the top  |
 |
 |
|
 |
 |
|
 |
|


